The Jackson Hole Report will no longer be distributed in a printed a mailed format. Sign up to receive quarterly market report updates via email.
64
Closings (down 15%)

The Jackson Hole Report will no longer be distributed in a printed a mailed format. Sign up to receive quarterly market report updates via email.
JACKSON HOLE REAL ESTATE REPORT
The Jackson Hole Report is published semi-annually, with additional email updates for the first and third quarters. While other Realtors attempt to report on our market with MLS statistics only (MLS historically tracks 65-70% of the market), we track every single transaction in Teton County. This data-driven report is the oldest, most accurate and trusted real estate news source in Teton County, Wyoming.
The lack of inventory and scarcity of available land in Jackson Hole can be summed up in three words: Conservation versus expansion.
The region’s early history saw development constrained by the natural topography, which influenced where homesteaders could settle. By 1950, the consolidation of the 1929 Park and the 1943 National Monument, which included Rockefeller’s acreage, resulted in a staggering 97% of the valley being designated as public land and the expansion of the Greater Yellowstone Ecosystem.
Of the federal land, the National Park Service owns 45%, the National Elk Refuge 1%, and the National Forest Service nearly 51%. Various state and local entities own the remaining 2.8% within the Town of Jackson and the unincorporated county, amounting to 74,640 acres in private ownership.
The 2.8% of privately owned land in Teton County has seen significant development, conservation, submersion, or zoning for rural densities. Most of the private land, approximately 60,000 acres, is in Jackson Valley, with 1,182 acres within the Town of Jackson. Outlying communities like Alta and Buffalo Valley hold 6,890 acres and 4,030 acres, respectively.
Following the establishment of Teton County’s planning/building department in 1975, the Comprehensive (Comp) Plan with Land Development Regulations (LDRs) were introduced in 1978 which accelerated the development of private land. Prior to 1978, most platted subdivisions had parcels of three to six acres with no dedicated open space for migratory or view corridors. Resort subdivisions—like the JH Ski Corp., JH Racquet Club (Aspens), and JH Golf & Tennis—had already begun development prior to 1978.
The 1978 Comp Plan provided density bonuses for subdivisions that provided 50% or more dedicated open space. The goal was to create smaller, more affordable lots for locals to build their homes, and at the same time dedicate open space for migratory and view corridors. During the next 17 years, subdivisions like Rafter J Ranch (354 lots), Cottonwood Park I & II (186 lots), Melody Ranch (244 lots), Teton Pines (125 lots), and Bar B Bar (69 lots) sprung to life. Other subdivisions chose to develop 3-acre or larger parcels like John Dodge/Homestead (112 lots), Solitude (105 lots), Owl Creek (57 lots), Dairy Ranches (26 lots), and Teal Trace/Pine Meadow (40 lots), which did not require dedicated open space.
The 1994 Comp Plan replaced the 1978 plan and updated the LDRs. A major stimulus for the 1994 Plan was a series of traffic projections and the resultant roadway improvements they foretold. The community realized that a significant amount of growth was occurring and feared that the character of the town and county were about to change.
As a result, the town and county launched a joint planning effort designed to produce a single comprehensive plan and LDR for both jurisdictions. Central to the effort was the objective to direct growth away from a blanket of three- and six-acre lots that the county’s plan and LDRs at the time allowed. The town and county hired a consulting firm to prepare a community-wide, character-based Comprehensive Plan and LDRs. The consultants completed their work, and the town and county planning commissions further developed the plan to its completion.
The 1994 Jackson/Teton County Comprehensive Plan (1994 Plan) provided density bonuses if 70% of the subdivision was dedicated to open space. Unfortunately, only one single-family subdivision, Wilson Meadows, used the density bonus after 1994. Constraints imposed by the plan led to a substantial increase in average housing prices over the next 30 years, stopping development with any significant density for locals to build their homes. NOTE: In 1994, the average sale price for a single-family home was $478,000. At the end of 2023, it was $5.03 million.
Chapter 5 (1994 Plan), Affordable Housing: The analysis of affordable housing was performed in 1994, and the county and town adopted Chapter 5, Affordable Housing in early 1995. The first attainable subdivision of its kind was Mountain View Meadows Townhomes, whose plat was recorded in February 1994.
The 1994 Plan established goals to provide a variety of affordable housing for Teton County’s socially and economically diverse population and establish a balanced program of incentives, requirements, and public and private actions. The 1994 Plan established that 25% of future population increases needed affordable housing. However, the 2007 Housing Needs Assessment suggested that at least 40% of new residential development needed to be affordable.
While the community had made headway in providing affordable housing, by 2007 most local workers were already priced out of free-market homes and had to turn to townhome/condos. NOTE: In 2007, the average condo sale price was $811,860 versus $2.09 million today.
Current single-family home inventory, broken down by decade built (see below), reveals a critical shortage. Limited spec building in the last 15 years coupled with a decline in homes for sale and rising prices presents challenges for both single-family home and townhome/condo Buyers.
Unfortunately, with the spike in interest rates many homeowners choosing not to sell. Economists dub the phenomenon the “rate lock-in effect.” They say rate lock-in happens when homeowners tie themselves to their low mortgage rates from when they bought or refinanced their homes. As a result, they end up staying in their current home even when they long to move up, downsize, or relocate.
Rate lock-in is not victimless (and is not the same thing as “locking” an interest rate before closing on a mortgage). It keeps properties off the market at a time when demand for homes exceeds the paltry supply, causing prices to skyrocket and promoting ruthless competition. First-time home buyers are especially disadvantaged because they don’t have equity to convert to down payments.
Fannie Mae conducted a recent study, and the results showed around 29% of homeowners reported hanging onto their homes for longer than they intended, but their motivations were driven by other factors unrelated to mortgage rates: 19% said they liked their home and location, and 13% said that home prices were too high to buy elsewhere. An additional 13% said they planned to stay because of the location of their job and/or family.
Older generations’ preference to continue to live in their homes as they age may also play a role in constraining supply, Fannie Mae said. The authors noted that nearly a third of homeowners are Baby Boomers, and over 80% said they would like to “age in place.” Unfortunately, our increasing real estate taxes are pushing JH retirees to sell.
As of December 31, 2023 there were a total of 58 single-family homes for sale (down 25% from 2022) at an average list price of $8.625 million (up 13%). Of the 58 homes, only two are listed for under $2 million, and 29 (down 24%) are listed for over $5 million.
Based on homes built between 2020-2024, we are on track to have 764 new homes built this decade. Also note: of the homes built since 2020, 157 were built on less than one acre, 81 were in the Town of Jackson, and 46 scrapped an older home. [If the last stat contains a number with percentage, you may consider including a percentage for the other two stat numbers for consistency]
Homes (6,130) & Townhome/Condos (3,267) Current Inventory
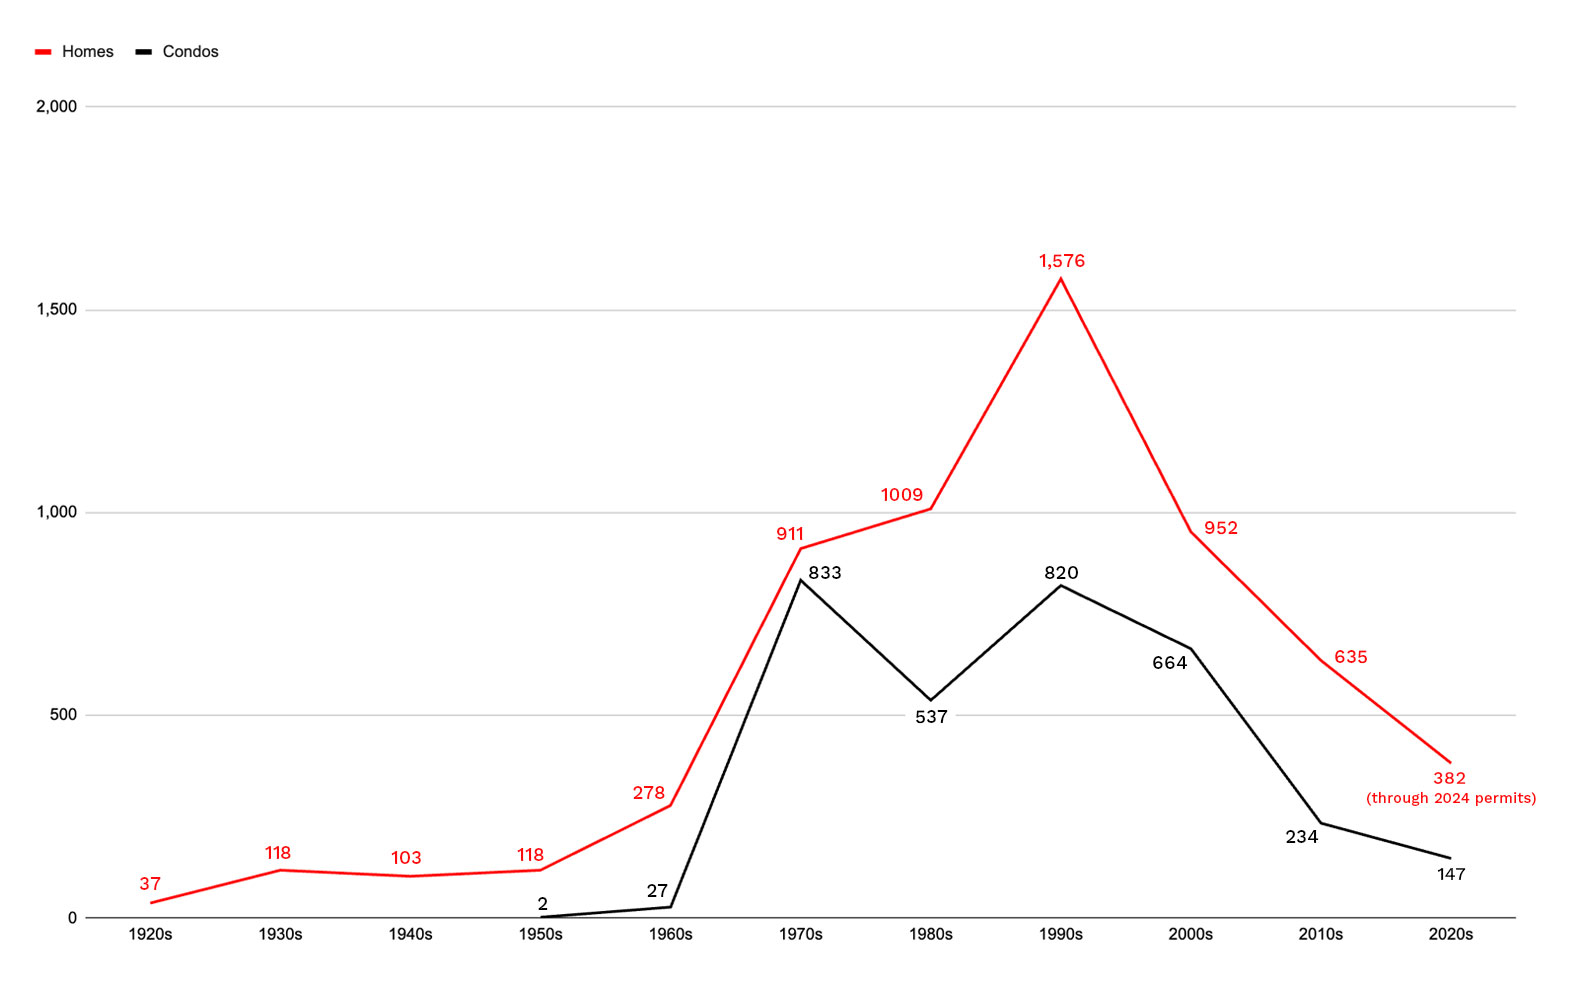
Current Deeded Townhome/Condo Inventory: There are currently a total of 3,267 free-market townhome/condos throughout the valley. Above we’ve broken out this inventory by decade built. NOTE: Of the townhome/condos built and sold on the open market valley-wide since 2020, the average sale price was $3.46 million. Of those 147 units, 118 were built in the Town of Jackson with an average sale price of $2.94 million.
As of December 31, 2023, there were a total of 56 Townhome/condos for sale at an average list price of $2.67 million. Of the 56 Townhome/condos, 9 are listed for under $1 million, and 28 are listed for over $2 million.
Where will Additional Housing Inventory come from? Anticipating future housing needs, reliance on existing vacant lots and scrappers is evident. Currently, there are 1,292 single-family vacant lots left valley-wide. They break down as follows: (Put in a box) 103 in the Town of Jackson, 405 on the Westbank (61 in Teton Village, 30 in Teton Pines, 144 N. of Wilson, and 170 S. of Wilson), 429 North of Hwy. 22 to Moran, 224 South of Hwy. 22 to Swinging Bridge, and 131 from Swinging Bridge to the southern county line.
Based on the current absorption rate, the 1,292 lots should provide about 17 years of future inventory. While 14% of the homes built since 2020 scrapped an existing home, we cannot rely on this percentage to continue. With only two homes currently on the market for under $2 million, many Buyers are choosing to “not” scrap and instead remodel and/or add on to the existing structure. This decision is being driven by the high cost of new construction versus remodeling.
There are several state-owned sections still in Teton County, but only two have potential for development. One is on Moose-Wilson Road and the other is near Kelly. Both are 640 acres, but traffic and infrastructure are not conducive for dense development in either.
The evolving demographic landscape—characterized by affluent, Baby Boomer, second homeowners and remote workers—intensifies the demand for housing in Jackson Hole. The self-sustainability of bedroom communities poses challenges, emphasizing the need to explore expansion options such as the proposed Northern South Park development.
Collaboration for Expansion: In 2020, the Town and County sponsored a community-wide planning process to create a preferred neighborhood plan for Northern South Park (NSP). In July 2022, the Town and County unanimously approved a neighborhood plan that set a vision for NSP.
With this plan approved for NSP, the Gill family announced their intention for a once-in-a-lifetime gift of 45 acres of land for affordable and workforce housing to the Community Housing Trust and Teton Habitat. By eliminating land costs for the development of deed-restricted homes, the Gill family is innovating new ways to respond to the community’s intense housing shortage that lessen the burden on taxpayers.
NSP will provide 420 deed-restricted homes, of which 240 will be Affordable and 180 Workforce. If you’d like to know more about the NSP development, as currently being proposed, check out our Podcast . We visited with the Community Housing Trust and Teton Habitat, as well as representatives of the Gill family, and discussed different components of the development, cost and pricing, the expected buildout timeframe, as well as concerns about traffic, schools, etc.
Let’s face it, our local workers have been priced out of this market for 20+ years. The only way to keep our workforce in the valley is through affordable housing efforts.
Self-sustaining bedroom communities: Those of you who lived in JH back in 2007 may remember when Driggs/Victor had four newly approved golf course communities, and over 1,800 platted undeveloped single-family lots. Star Valley was also booming with the new Alpine Meadows (166 lots), a new Airpark, and smaller subdivisions sprouting up everywhere. At the time, concern grew over whether our bedroom communities were becoming self-sustaining, meaning workers no longer needed to commute over the pass or down the canyon—which can be very dangerous at times!
While the Great Recession of 2008-09 slowed the growth of our bedroom communities, they are once again becoming self-sustaining. This time, though, growth has been driven even more by rising home prices. Many of the Baby Boomers, who had planned to retire in JH prior to COVID, had to redirect their searches as prices doubled in Jackson Hole, giving these bedroom communities another boost in demand while their inventory has also been historically low.
We recently reached out to several general contractors in the area to determine the cost of building the American Dream. We found the cost to build a quality, single-family home with above average finishes in Victor/Driggs was $500 per sq. ft., $450 per sq. ft. in Star Valley, and in Jackson Hole costs start at $1,000 and can quickly reach $2,500 per sq. ft. NOTE: If the Northern South Park development moves forward, even with free land, it will still cost $600 per sq. ft. to build Affordable and Workforce housing. Are we at the breaking point for future Affordable housing?
Conclusion: The delicate balance between conservation and expansion defines Jackson Hole’s journey. As the community grapples with the housing crisis, addressing the challenges posed by limited inventory, rising prices, and changing demographics becomes imperative for ensuring a sustainable future. Explore more about the ongoing narrative in our Podcast.
To read the full report, visit www.jacksonholereport.com
Questions? Comments?
group@jacksonholereport.com
CLOSINGS
22% Decrease
OVERALL DOLLAR VOLUME
24% Decrease
*Still the fourth highest in history
ACTIVE LISTINGS VALLEY WIDE NO CHANGE FROM 2022
All Home, Lot, Condo, Multi-Family & Commercial
*Third lowest level of overall available inventory in more than 40 years

The hotspot in 2023 sat between $1 and $3 million, where 139 transactions (41%) occurred. With only 15 homes listed in this price range, we predict prices will continue to creep up in 2024. NOTE: In 2023, 66 homes sold in this price range. Zoom Town Buyers and Baby Boomers will continue to flock to our market, but our underlying question remains: How much inventory will be available for Buyers? NOTE: This is the third lowest level of overall available inventory in more than 40 years.

Overall real estate currently under contract: At year’s end, there were 30 properties under contract (down 17%) with an average list price of $6.27 million (up 58%) and a median list price of $2.95 million (up 13%). The decrease in the number of overall properties under contract is the direct result of the decreased available inventory—the third lowest level in 40 years. Of the 30 properties under contract, 11 are on the Westbank with a combined list price of $67.3 million.

Current overall available inventory did not change (167) when compared to the close of 2022, making year-end 2022 and 2023 the third lowest level of overall available inventory in more than 40 years. NOTE:The $1 to $3 million segment reported the most current active listings with 68. The under $1 million segment only logged in 10 active listings at the end of 2023. Also, do not expect overall inventory to increase until late spring 2024.


The Jackson Hole Report will no longer be distributed in a printed a mailed format. Sign up to receive quarterly market report updates via email.
YEAR END 2023
When compared to 2022, the number of sales decreased 15% and the dollar volume decreased 15%, totaling $849 million. In contrast, the average sale price did not change, and the median sale price only went down 2%. NOTE: Twenty-five homes sold for over $10 million in 2023, up 25%.
The under $1 million market continues to slip away, representing only three home sales in 2023. Current inventory represents one homes in this price range ($990k) and one between $1 and $2 million. These segments continue to reflect brisk activity and the ever-intensifying appetite for properties priced below $2 million. When a well-priced home hits the market in this segment, bidding wars continue to ensue within 72 hours.
Single-family home hotspot: Town of Jackson and South of Jackson to the County line, shared the spotlight. Forty-nine homes sold in the Town of Jackson, and 50 homes sold South of Jackson. These two areas represent 59% of all homes sold in 2023. The area reporting the highest increase in home sales was South of Wilson where 22 sales occurred (up 100%).
Within the single-family home market, the $1+ million segment reported 166 transactions in 2023. All told, in 2023 there were 100 single-family home sales above $3 million (down 10%), 54 above $5 million (down 19%), 25 above $10 million (up 25%) and one above $20 million. NOTE: Only three homes sold for less than $1 million in 2023.
Homes currently under contract: As of year’s end, 12 homes were under contract (down 8%) with an average listing price of $6.5 million (up 93%) and a median list price of $5 million (up 100%). The increase in the average and median list price of homes under contract is the direct result of eight (67%) being listed for over $5 million.

Homes currently on the market: The open market currently has 58 homes (down 25%) listed with an average list price of $8.625 million and a median list price of $5 million. Of the 58 single-family homes currently on the market, zero are listed for under $1 million ($990k), and only one is listed between $1 and $2 million valley wide. The other 56 break out as follows: 14 between $2 and $3 million, 13 between $3 and $5 million; 12 between $5 and $10 million; 10 between $10 and $20 million and 7 over $20 million.

Least expensive single-family zoned home listing at year’s end: A 2-bedroom, 1-bath, 1,048 sq. ft. home built in 2000 on a .08-acre lot in the Sage Meadow Subdivision listed for $990,000.
Most expensive single-family home listing at year’s end: $37.5 million for a 4.5-acre private estate In Lake Creek Ranch and on Lake Creek and across from the Jackson Hole Mountain Resort with a 9,696 sq. ft. log home (4 bedrooms, 7 baths). Owners in Lake Creek Ranch have exclusive privileges of on-site horse-back riding, private Snake River access and out-the-door trout fishing.
Most expensive single-family home sale in 2023: Listed at $27 million the 90-acre private estate located South of Wilson had a 11,532 sq. ft. log home (5 bedrooms, 6.5 baths), and a 1,040 sq. ft. guest house.

YEAR END 2023
When compared to 2022, the number of sales decreased 20% and dollar volume decreased 36%. Following suit, the average and median sale prices both decreased 19%. Of the 105 sales, 36 sold for under $1 million (up 64%). With only nine condos currently on the market for under $1 million and 56 overall listings (six months of inventory), expect this segment of the market to continue to increase in value in 2024. NOTE: The under $1 million segment accounted for 34% of all condo sales in 2023.
There were no condos under contract at the end of the year.
Condo/townhome hotspot: Town of Jackson had the highest number of condo sales in 2023 with 65. The average sale price of $1.8 million (down 17%) and the median sale price was $995,000.
Condo/townhomes currently under contract: The number of condo/townhomes currently under contract decreased 10%. Following suit, the average and median list prices decreased 70%, and 76%, respectively. The decrease in the average and median list prices can be directly attributed to 2022 being a record-breaking year for both.
Current condo/townhome market inventory is up 44% when compared to the same period in 2022 with 56 available units. Meanwhile, the average and median list prices are down 5% and 15%, respectively. Of the 56 condo/townhomes currently on the market, nine are listed for between $500,000 and $1 million, 19 between $1 million and $2 million, 19 between $2 million and $5 million, and nine over $5 million.
Least expensive condo/townhome listing at year’s-end: $625,000, which buys you a 608 sq. ft., 1-bedroom 1-bath condo in the Town of Jackson.
Most expensive condo/townhome listed in MLS at year’s-end: $7.95 million, which buys you a 3,516 sq. ft. 4-bedroom, 3.5-bath condo in Granite Ridge (Teton Village).

YEAR END 2023
When compared to 2022, the number of lot sales and median sale price were down 8% and 12% respectively. In contrast, the average sale price of $3.56 million is up 7% breaking yet another record. The decrease in the number of sales in 2023 can be directly attributed to the lack of inventory under $1 million. Out of the 44 sales, only seven sold for under $1 million, and none currently listed for under $1 million. The least expensive lot listing, as of January 1, 2024, is $1.295 million in the JH Golf & Tennis.
Historically, the 44 sales at the end of 2023 are the second lowest number of sales in over 40 years. In contrast, at the end of 1999, there were 335 vacant residential land sales.
Historically, the 42 current listings are the fourth lowest number of listings in over 40 years. In contrast, at the end of 1996, there were 551 active vacant residential land listings.
For those still looking for post-recession bargains, there are currently no single-family lots for sale under $1 million. With only seven selling in for under $1 million in 2023, and the vanishing supply of single-family homes for under $1 million, expect to see the under $1 million vacant land segment vanish in 2024. NOTE: 83% of the vacant land sales in 2023 were purchased with cash.
The $5+ million segment of residential lot sales is down 50% (17 sales) when compared to 2022. NOTE: Currently 30% of the available residential vacant land inventory is listed for more than $5 million.
Residential lots currently under contract: Compared to 2022, seven lots are currently under contract (up 40%). Following suit, the average and median list prices increased 205% and 217%, respectively (both recording breaking). This dramatic increase in both average and median list prices reflects three of the seven being listed for over $5 million. NOTE: Residential vacant lots have about twelve months of inventory, based on the 2023 performance.
Available vacant land listings: Available inventory increased 5% when compared to 2022 with 42 available single-family home sites. The average listing price was $4.6 million (down 25%), and the median listing price was $3.1 million (up 15% and record breaking). Residential vacant lot values continue to strengthen with land bargains few and far between. Available inventory breaks down as follows: Zero under $1 million; 11 listings between $1 and $2 million; 19 between $2 and $5 million; nine between $5 and $10 million; and four over $10 million. NOTE: Of the 42 listings, only nine (21%) have more than 35 acres.
Least expensive lot listing at year’s end: $1.295 million for a .7-acre single-family lot in the Jackson Hole Golf & Tennis Resort.
Most expensive single-family lot listing at year’s end: $16.45 million for 1.8 acres on the golf course in Shooting Star.

The Jackson Hole Report will no longer be distributed in a printed a mailed format. Sign up to receive quarterly market report updates via email.
*While other local Real Estate Brokers attempt to report on the local real estate market, we are the only ones to track every single transaction. Therefore, if you want the most accurate information to help guide you through your next real estate transaction, please call Devon, Luke, or David today. “We are the Experts”.
*All statistics are supplied by sources that have been deemed reliable but are not guaranteed.
*All statistics quoted in this newsletter are based on sales in 2023 compared to sales in 2022.
*Median sale price is the cost of a property that has an equal number of sales above and below it on the price scale.
*Average sale price is the total combined dollar volume divided by the number of sales.
*In this report, “overall” refers to all sales in Teton County combined (homes, lots, condos, commercial, ranch), not including Alta, WY.
*The term “Market Value” means; the value of a property in terms of what it can be sold for on the open market; current value.
© Copyright 1995 – 2024 by David Viehman and Devon Viehman, dba Engel & Volkers Jackson Hole. All rights reserved. No part of this publication may be reproduced or transmitted in any form or by any means without explicitly written permission from David Viehman.
Post Office Box 2431
70 S King St
Jackson, WY 83001
(855) 722-2023 Fax
Associate Broker
307.690.4004
david@jacksonholereport.com
Associate Broker
307.690.0621
devon@jacksonholereport.com
Associate Broker
307.699.5921
luke@jacksonholereport.com


